 4.9 (349 Reviews)
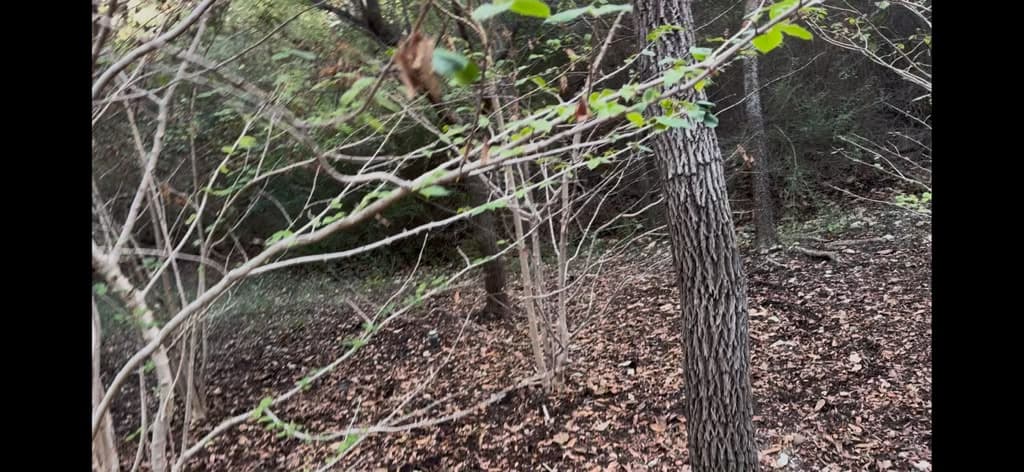
Today we’re here in Westover Hills, Texas, working on a Plant Healthcare case where our goal is to identify a potential problem before we allow it to damage an established landscape.
This property has a water well that is going to become part of the irrigation program. The laboratory water analysis has raised two major concerns that we need to investigate further:
Elevated salts in the well water and a pH above 9.
Before this water is introduced throughout the landscape, we’re establishing a baseline by collecting soil samples and sending them to Texas A&M.
Then we’re going to approach this like Tree Doctors.
We’re going to establish what the soil looks like today.
The well company will introduce its water-treatment technology.
We’ll begin introducing the treated well water into a designated portion of the landscape.
We’ll physically monitor the plants.
We’ll monitor soil chemistry.
And approximately 30 days later, we’ll return and collect another round of soil samples.
Then we’ll compare:
Before versus after.
That’s how we begin separating assumptions from evidence.
⸻
Why Irrigation Water Quality Matters to Plant Healthcare
When we diagnose declining trees and shrubs, homeowners naturally focus on insects, diseases, fertilizer, and irrigation frequency.
But there’s another question that should sometimes come first:
What’s actually in the water?
Water can appear perfectly clean while containing dissolved minerals capable of influencing soil chemistry over time.
When irrigation water enters the soil, the water itself may eventually be absorbed by plants, evaporate, or move deeper into the soil profile.
The dissolved constituents don’t necessarily disappear with it.
Depending upon the chemistry, drainage, irrigation frequency, rainfall, and soil structure, some salts can accumulate within the root environment.
That’s why irrigation water should be treated as part of the Plant Healthcare system.
⸻
Understanding the Reported 42 PPM Salt Reading
The well-water analysis contains a reported value of approximately 42 ppm for a salt-related constituent.
Before calling that number “astronomically high,” we need to identify exactly what the laboratory measured.
Was it sodium?
Chloride?
Another dissolved ion?
Total dissolved solids?
Those are not interchangeable measurements.
For irrigation suitability, I want to evaluate the complete water analysis, particularly measurements such as:
- Electrical conductivity
- Sodium
- Chloride
- Calcium
- Magnesium
- Bicarbonate
- Alkalinity
- Sodium adsorption ratio when applicable
- Total dissolved constituents
This is exactly why we’re approaching the project systematically.
One number gives us a clue.
The entire chemistry gives us the diagnosis.
⸻
Why Excessive Salinity Can Damage Plants
Plants don’t simply “drink” water like we drink from a glass.
Water movement through the soil-plant system is governed partly by differences in water potential.
When soluble salt concentrations increase around the root system, the osmotic component of water potential changes.
In homeowner language:
The roots have a harder time extracting water.
That’s one of the strange things about salinity stress.
The soil can physically contain moisture while the plant behaves as though it’s experiencing drought.
⸻
What Salt Stress Can Look Like Above Ground
Depending upon the species and severity, excessive salts can contribute to:
- Marginal leaf burn
- Leaf-tip necrosis
- Wilting
- Chlorosis
- Premature leaf drop
- Reduced shoot elongation
- Root stress
- Progressive canopy thinning
That’s why the foliage becomes part of our monitoring system during this 30-day trial.
The plants become biological indicators.
⸻
Necrotic Tissue Will Get My Attention Immediately
During the trial period, I’ll continue walking the property and monitoring the plants.
I’m specifically looking for new necrotic tissue.
Necrosis simply means plant tissue has died.
If previously stable plants begin developing abnormal leaf-tip burn, marginal scorch, wilting, chlorosis, or premature defoliation after the new irrigation source is introduced, I’m not going to simply wait until day 30.
That becomes an immediate diagnostic trigger.
We document what we’re seeing.
We evaluate irrigation.
We consider suspending the new water source.
And we collect additional samples if necessary.
The monitoring program has to be capable of stopping the experiment before significant landscape damage occurs.
⸻
Salts Can Also Affect the Soil
The concern isn’t limited to foliage.
We’re protecting the soil.
Repeated irrigation can influence the chemistry of the root zone.
Depending upon which ions are present, excessive salts can influence:
- Plant water uptake
- Root physiology
- Soil structure
- Nutrient availability
- Microbial communities
- Water infiltration
This is why we’re taking a soil sample before introducing the new irrigation water.
Without a baseline, we won’t know what changed.
⸻
Sodium Deserves Special Attention
If sodium is one of the primary concerns in the well water, we have to think beyond simple salinity.
Excessive sodium relative to calcium and magnesium can negatively affect susceptible clay soils.
Clay particles can become dispersed.
Soil aggregation can deteriorate.
Macropore connectivity can decline.
That can contribute to:
- Reduced infiltration
- Poor drainage
- Surface sealing
- Reduced oxygen movement
- Compaction-like conditions
- Restricted root development
Now what began as a water-quality problem becomes a soil-structure problem.
⸻
The pH Above 9 Is a Separate Challenge
The well water reportedly has a pH greater than 9.
That’s another condition we need to manage carefully.
However, there’s an important distinction homeowners need to understand.
Water pH by itself doesn’t tell us everything about how strongly that water will affect soil pH.
We also need to understand alkalinity, particularly bicarbonate and carbonate concentrations.
Two water sources can have similar pH readings but very different capacities to neutralize acidity and influence soil chemistry.
That’s why laboratory water analysis is more valuable than relying solely on a handheld pH meter.
⸻
Why High pH Can Affect Plant Nutrition
As soil chemistry becomes increasingly alkaline, several micronutrients can become less available to plants.
Iron is a classic example.
Manganese and zinc can also become less available under alkaline conditions.
The nutrient may physically exist in the soil.
The problem is bioavailability.
The plant cannot access it efficiently.
That’s when we may begin seeing:
- Interveinal chlorosis
- Reduced chlorophyll production
- Weak growth
- Reduced photosynthesis
- Chronic plant stress
Simply adding more fertilizer may not correct the underlying chemistry.
⸻
Controlled Acidification May Become Part of the Solution
Highly alkaline irrigation water can sometimes be treated through controlled acid injection.
But this should be based on laboratory chemistry—not guesswork.
The treatment requirement depends heavily on the water’s alkalinity.
We’re not simply trying to make a pH meter display a lower number.
We’re attempting to manage the chemistry responsibly.
The well company and water-treatment professionals need to determine the appropriate treatment system, dosage, monitoring, and safety procedures.
Our responsibility on the Plant Healthcare side is evaluating how the soil and plants respond.
⸻
What the Well Company Is Trying to Accomplish
The well company is introducing a technology designed to modify how problematic ions behave within the irrigation water and reduce their negative impact on the landscape.
That’s their side of the equation.
My responsibility is different.
I’m not going to assume the technology works because equipment was installed.
I’m going to evaluate the results.
Did soil salinity change?
Did pH change?
Did plants develop symptoms?
Did the soil remain biologically and chemically suitable for roots?
That’s why we need before-and-after testing.
⸻
Step One — Establish the Baseline
Before introducing the treated well water, we’re collecting representative soil samples from the designated irrigation area.
Those samples are going to Texas A&M.
This gives us a chemical snapshot of the soil before the new variable is introduced.
That’s our control point.
Without it, we would be guessing later.
⸻
Step Two — Introduce the Treated Well Water
Once the baseline is established, the well company can begin implementing the new water-treatment technology within the designated irrigation area.
Now the clock starts.
For approximately 30 days, the treated well water becomes the new variable.
We aren’t simply waiting.
We’re monitoring.
⸻
Step Three — Monitor the Plants
This is where Plant Healthcare becomes very practical.
I’m going to use the landscape itself as part of the diagnostic process.
We’ll monitor:
- Leaf margins
- Leaf tips
- Foliage color
- Wilting
- Premature defoliation
- New necrotic tissue
- Overall plant vigor
The plants are essentially telling us whether their environment is changing faster than they can tolerate.
⸻
Step Four — Monitor the Soil Weekly
I also recommend checking soil conditions approximately once a week during this initial introduction period.
A quality field pH meter can help us identify trends.
Depending upon the equipment available, soil EC monitoring can be even more useful when salinity is the primary concern.
Field equipment does not replace Texas A&M laboratory analysis.
But it gives us an early-warning system between laboratory tests.
If something begins moving dramatically in the wrong direction, I want to know before the landscape becomes severely damaged.
⸻
A pH Meter Is a Diagnostic Tool, Not the Entire Diagnosis
I strongly encourage homeowners and property managers responsible for high-value landscapes to understand basic soil monitoring.
But a pH meter has limitations.
It tells us acidity or alkalinity under the measurement conditions.
It does not tell us:
- Which salts are present
- Sodium adsorption ratio
- Chloride concentration
- Bicarbonate concentration
- Overall nutrient balance
- Root health
That’s why field measurements and laboratory testing should work together.
⸻
Electrical Conductivity Is Important for Salinity
When we’re specifically concerned about soluble salts, electrical conductivity—EC—is one of the measurements I want to follow closely.
Dissolved ions allow water or soil solution to conduct electricity.
As soluble salt concentration increases, electrical conductivity generally increases.
That makes EC a useful monitoring tool.
Again, it doesn’t tell us exactly which ions are present.
But it can tell us whether overall soluble-salt conditions are changing.
⸻
Step Five — Return in 30 Days
Approximately 30 days after introducing the treated well water, we’ll return and collect another set of soil samples from comparable locations and depths.
Then we send those samples back to the laboratory.
Now we have:
BEFORE
and
AFTER.
That’s when the investigation becomes much more powerful.
⸻
Compare Apples to Apples
For before-and-after soil testing to mean something, sampling needs to be reasonably consistent.
We want comparable:
- Locations
- Depths
- Sampling methods
- Laboratory methods
Otherwise, differences between the two reports could simply reflect differences in where we collected the soil.
Consistency creates better evidence.
⸻
What Success Looks Like
If we reach the end of the 30-day period and:
The plants remain stable,
we don’t see new abnormal necrosis,
soil EC remains acceptable,
pH and salinity-related measurements remain within appropriate parameters,
and
the follow-up laboratory report does not show problematic accumulation,
then we have evidence that the treatment strategy is performing appropriately during this initial trial.
That’s very different from simply saying:
“The system seems to work.”
We measured it.
⸻
What Happens If the Plants Begin Declining?
If we begin seeing abnormal necrotic tissue during the trial, the response changes immediately.
We don’t continue blindly.
We stop or modify the irrigation introduction as appropriate.
We document the symptoms.
We check soil moisture.
We check pH and EC.
We evaluate irrigation distribution.
Then we collect additional samples if necessary.
Now we’re back to the process of elimination.
⸻
Correlation Is Not Automatically Causation
This is another important part of being a Tree Doctor.
If a plant develops brown leaves on day 15, we cannot automatically declare:
“The well water killed it.”
Maybe it did.
But we still have to investigate.
Was there drought stress?
Overwatering?
Root disease?
A fertilizer application?
Herbicide exposure?
Heat stress?
Natural dormancy?
That’s why documentation matters.
The timeline helps us separate coincidence from causation.
⸻
Winter Is Working Against Our Diagnostic Window
One reason I’m particularly interested in this next 30-day period is that winter is approaching.
Some deciduous plants will naturally begin losing their foliage.
Once that happens, we lose one of our easiest biological indicators.
During the growing season, leaves quickly show us:
- Chlorosis
- Marginal burn
- Wilting
- Necrosis
- Abnormal defoliation
When those leaves disappear naturally, we have less visual information.
⸻
Laboratory Monitoring Becomes More Important in Winter
The soil doesn’t stop giving us information simply because the leaves are gone.
During dormancy, laboratory testing becomes even more valuable.
We can continue monitoring:
- pH
- Electrical conductivity
- Sodium-related conditions
- Salinity
- Soil chemistry
That allows us to continue evaluating the irrigation program even when canopy observations become less reliable.
⸻
Why Water Testing Should Be Part of Every Serious Plant Healthcare Program
One of the biggest lessons from this Westover Hills project is that soil testing alone doesn’t always tell the entire story.
Ask yourself:
What water are we repeatedly putting into that soil?
Municipal water.
Well water.
Reclaimed water.
Each source can have different chemistry.
If you’re managing a valuable landscape, especially with private well irrigation, periodically testing the water can reveal problems before they become visible in the plants.
⸻
Water and Soil Are One System
The irrigation system and the soil cannot be treated as separate worlds.
Every irrigation cycle introduces water and dissolved constituents into the root environment.
Plants remove some water.
Evaporation removes some.
Drainage moves some downward.
Certain dissolved constituents can remain.
Then we irrigate again.
Over hundreds of irrigation cycles, water chemistry can influence soil chemistry.
That’s why Plant Healthcare needs to look at the whole system.
⸻
Don’t Wait Until Plants Become Postmortem
The traditional approach is often reactive.
A shrub turns brown.
A tree begins dropping leaves.
Then somebody gets called.
By that point, substantial physiological damage may already have occurred.
We’re taking the opposite approach here.
We’re asking the questions first.
We’re testing first.
We’re establishing baseline conditions first.
Then we’re introducing the change.
That’s prevention.
⸻
This Is Plant Healthcare Forensics
I like calling this Plant Healthcare forensics because that’s essentially what we’re doing.
We’re building a case.
We establish the timeline.
We collect evidence.
We introduce a known variable.
We observe biological responses.
We retest.
Then we compare.
That gives us something far more valuable than an opinion.
It gives us evidence from which to make the next decision.
⸻
Final Thoughts
Today in Westover Hills, Texas, we’re sending soil samples to Texas A&M before introducing treated well water into an established landscape.
The well-water analysis has raised concerns about salt-related chemistry and a pH greater than 9.
Rather than gambling with valuable trees and landscape plants, we’re establishing a baseline.
The well company will implement its ion-treatment technology.
We’ll introduce the treated water.
We’ll monitor the plants.
We’ll check field pH and soil conditions.
We’ll watch carefully for necrotic tissue.
And in approximately 30 days, we’ll return and collect another laboratory soil sample.
Then we’ll compare the evidence.
If the plants remain healthy and the laboratory chemistry remains stable, we’ll have evidence supporting the treatment technology.
If the plants begin developing abnormal necrosis or the laboratory numbers begin moving in the wrong direction, we’ll stop, retest, and begin ruling out causation before more damage occurs.
That’s how we approach Plant Healthcare at Arborist USA.
Not guessing.
Not waiting until everything turns brown.
Establish the baseline.
Monitor the patient.
Retest.
Compare.
Then make the next decision based on evidence.
For general tree-care best practices, homeowners can also reference guidance from the Texas A&M Forest Service, https://tfsweb.tamu.edu/trees/, a trusted authority on Texas tree health.
Schedule a professional inspection. Early detection and scientific intervention are the difference between preservation and loss. If you’d like to speak to an arborist, please call us at 817-880-6130 or visit https://www.arboristusa.com
Today we’re in Westover Hills, Texas, conducting what I like to call Plant Healthcare forensics.
We’re preparing to introduce well water into a portion of this landscape, but the water analysis raised concerns about salt-related chemistry and a very high pH above 9. Before we introduce that water to valuable trees and landscape plants, we’re establishing a baseline.
Today we’re collecting soil samples and sending them to Texas A&M so we know exactly what the soil chemistry looks like before the irrigation change. Then the well company will introduce its water-treatment technology designed to address problematic ions within the well water. But we’re not simply going to assume the technology works.